
Episode 11: Combating PPC click fraud and a new Google SERP
Google is making changes to how both organic and paid listings look in the...

In the Search With Candour podcast, Mark Williams-Cook and I have previously covered the issue of click fraud in PPC advertising. For those who want to get up to speed and listen to the podcasts, you can listen to the following episodes on the topic: 11 - Combating PPC Fraud and 50 - Google Guest Post Crackdown, where we discuss the issue of dubious, low-quality traffic in detail and what you can do about it.
In both those episodes, I discussed some of the measures I had been carrying out to better track and mitigate click fraud, in order to improve overall performance for my clients’ accounts, save money, and more effectively avoid fraudulent traffic from impacting future performance.
In this article, I will share a few examples of Google Analytics segments you can use to better track and identify fraudulent click sources, as well as share a sneak peek into the click fraud tool I have been developing, which works by automatically identifying and reporting on suspected click fraud on the Display Network, whilst also highlighting high-quality placements where there is potential for a greater profit or lead generation.
If you are simply interested in creating some Segments I have been using or you just want a sneak peek into the tool I am working on to combat click fraud, please click here to skip through all the preamble! Otherwise, continue reading for a crash course in click fraud on the Display Network.
Please note that I use the term “click fraud” as an umbrella term, but really it covers all manner of nasty traffic, including accidental clicks, deliberate ad clicking from competitors, as well as fraudulent traffic generated by humans or bots for financial gain. Mark and I previously used the term “sh!t traffic” in one of the podcasts, but I’ll avoid using that here :D
Whether we like it or not, ad campaigns will always generate some fake traffic. Google refers to this type of traffic as an “invalid click”, and every ad account generates them. When Google identifies an invalid click, you are not charged for any such clicks, and you can even view the number of clicks generated in your account that were marked as invalid. Try it yourself - just add “invalid clicks” as a column in your campaign view, and take a look at your main offenders.
However, Google’s automated systems are not perfect, and not every non-compliant click is going to get picked up by Google. Where advertisers will undoubtedly find the most invalid traffic, is on the Google Display Network.
Fake traffic is never going to generate you, the advertiser, any revenue. Typically, advertisers mitigate this risk by using conversion tracking, so that any campaigns being run that fails to generate profit can be optimised accordingly. On the Display Network, placements, audiences and other targeting criteria that don’t generate revenue can be optimised accordingly or paused altogether. Simple enough, surely?
Well, if you’re an e-commerce operation, then yes - but what if your website is not e-commerce, but instead relies on lead generation, such as contact forms or call-back requests?
This is where fake traffic has been quite clever for some time, particularly on the Display Network. Enter the world of fake lead-generation.
Every website has undoubtedly received spam in some form or another. In most cases, this will get marked as spam by your email server, or simply deleted by the sales team when they deal with incoming enquiries. No harm is done. However, in my experience of managing display advertising campaigns, the Google Display Network is a channel rife with traffic that submits spam.
Let me explain why this is dangerous for many advertisers. I will illustrate this with the most typical example: an advertiser who does not have a unified marketing-to-offline-sale tracking system in place.
Step 1: Your Google Display advert is clicked on by a user.
Step 2: The user generates a contact form submission on your website.
Step 3: Google Ads logs a goal as being generated by the Display campaign.
Step 4: Your PPC manager sees that this particular Display campaign consistently generates a high volume of low-cost leads, so directs more advertising spend to it. They report this to you, and it looks like the PPC manager is doing an awesome job.
Step 5: MISSING STEP!!
The missing step should be obvious to those that already track and report on their lead journey/pipeline milestones in Google Ads, but for those who do not do this or are unaware, I shall help you out. One final, absolute valuable goal is still not being tracked: the sale itself. In many cases, there may, in fact, be other valuable steps prior to the sale worthy of tracking. Was the lead a qualified one? Was a sales demonstration or free trial arranged? Was a follow-up call generated? In any case, all we know was that some kind of lead was generated by Display activity.
So essentially, lead quality for this particular advertiser is never known. And for all you or the PPC manager know, the leads being generated could totally stink. What if they are not leads at all, but spammy advertisements for miracle cures, or simply blank messages, interspersed with gobbledygook?
I’m afraid to say that, in my experience for most B2B advertisers who are not tracking lead quality - specifically on the Google Display Network - a high proportion of the leads you are tracking will likely fall into this bracket.
In episode 11, I mentioned that I once audited a PPC account where the advertiser was spending several hundred thousand pounds per month on Display advertising alone. They had set up their own goals, which were being fired whenever the lead confirmation or thank-you page was fired. They were particularly at risk, however, because they had no captcha form in place, nor were they carrying out any form of lead-to-sale tracking from their sizeable ad campaign.
In addition to Display campaigns, their account also comprised a search campaign, which had generated a much higher cost-per-lead than its Display counterpart. The client’s conversion rate on the Display Network was better than on search (always a red flag). Instantly I was suspicious of this because no matter how on-point your Display targeting is as an outreach channel, typically advertising on the GDN is going to generate leads at a higher cost-per-lead, particularly nowadays where the cost-per-click on the GDN is much higher than it was several years ago. This isn’t always the case depending on your sector and objectives, but in my experience, these cases are in the minority.
So I looked at the websites that were generating traffic via this client’s Display campaigns and was unsurprised to see the usual mix of dubious sources, including:
All of which were generating high volumes of lead submissions. The cynic in me knew this was most likely to be fake traffic, and so after working closely with the client and examining the leads that were generated through the Display channel, I uncovered that most of them were unsurprisingly comprised of fake leads. In this instance, they were contact submissions comprised of random, unintelligible sentences, presumably created by something akin to a random string generator.
As this client did not have a unifying lead tracking system or even a basic quality check in place, all they knew was that leads were being generated by the Display Network by the efforts of their awesome PPC campaign. Therefore, “leads are good so let’s spend more to get more” was their strategy.
The ironic thing about one of the Display campaigns they had running - the one driving the most leads for them - was that it was one of Google’s Smart Display Campaigns. It was optimising for lead volume, and most of the lead volume turned out to be fake. So, to give Google its credit - it was showing ads where it would get most of its leads from. Unfortunately, those leads were all fake!
It’s worth noting that this was not the first time I had seen this type of fake lead behaviour - not to the extent in the real-life example above, where the advertiser had unfortunately spent over a million pounds in Display costs. But having managed many Display campaigns, I was not a stranger to this scenario.
And curiously, I also found that when I wanted to broach the subject to any new clients where I had uncovered this unfortunate fact, some of them were not receptive to the idea at all. It was almost as if some of their internal marketing team would rather pretend the issue didn’t exist, presumably because they didn’t want to become a scapegoat for someone higher up in the company who might be less than forgiving.
As I had seen this issue several times, always on campaigns with a sizeable display campaign, this had led me to investigate how this fake lead generation even happens, whether there were identifiable patterns, and what I could do to stop it, particularly when setting up new campaigns. To begin with, what could I put in place to speed up analysis and highlight potential fake traffic and leads? The scope of the GDN allows for huge reach, so it has such awesome potential, but for many advertisers, it is mired in low-quality traffic that never converts. It was always a continual struggle of battling low-quality traffic.
People who want to profit through rule-breaking will always find a loophole. The most common method of fake lead generation on the Display Network is as follows:
But Why????
Picture this: you own a network of websites or apps that are monetised, or you represent the interests of someone who profits from such websites. Every time ads on those sites or apps are clicked, you generate revenue.
If you are interested, I highly recommend reading the US Department of Justice’s report on how the FBI, with assistance from Google, helped track down such an illegal operation. The illegal operation was nicknamed Eve, and had generated tens of millions of dollars worth of fraudulent ad revenue on display networks before the perpetrators were found.
Display campaigns where this type of activity is being carried out are far more likely to be allocated higher spend from advertisers, when the advertiser sees that those ads are generating low-cost, regular leads; or that the campaigns are driving seemingly high-engaged traffic.
It’s easy to pinpoint fake traffic once you know what to look out for. You can spot red flag traffic easily in the User Explorer section in Google Analytics, and once you know what to look for you can create User Segments to track them. There are different types of fake traffic, but the three most common types that are easiest to track are as follows:
Now let’s take a look at how to create segments that identify these top three offenders.
To follow these examples, it is recommended that you have some understanding of how Google Analytics segments work. Be sure to check the segment is changed from a SESSION segment to a USER segment where shown. Each segment includes multiple layers of rules, some with AND/OR statements, so I hope you’re paying attention! If you get them wrong, the segment may not work as intended and show you the incorrect data.
All examples assume that your Default Channel Grouping in Google Analytics is showing your Display traffic as the Display channel, or that your Display campaigns have the word “Display” mentioned in their name. You can easily change the rules to accommodate your own structure, however. The examples also assume that you are correctly (and consistently) tagging traffic from other sources such as social media. I don’t want to be seeing any “Other” traffic in your Google Analytics reports, thank you very much!
Please note that all of the below segments are created under the Conditions section.
First Rule: Includes USERS who interacted with Display, AND visited more than once:
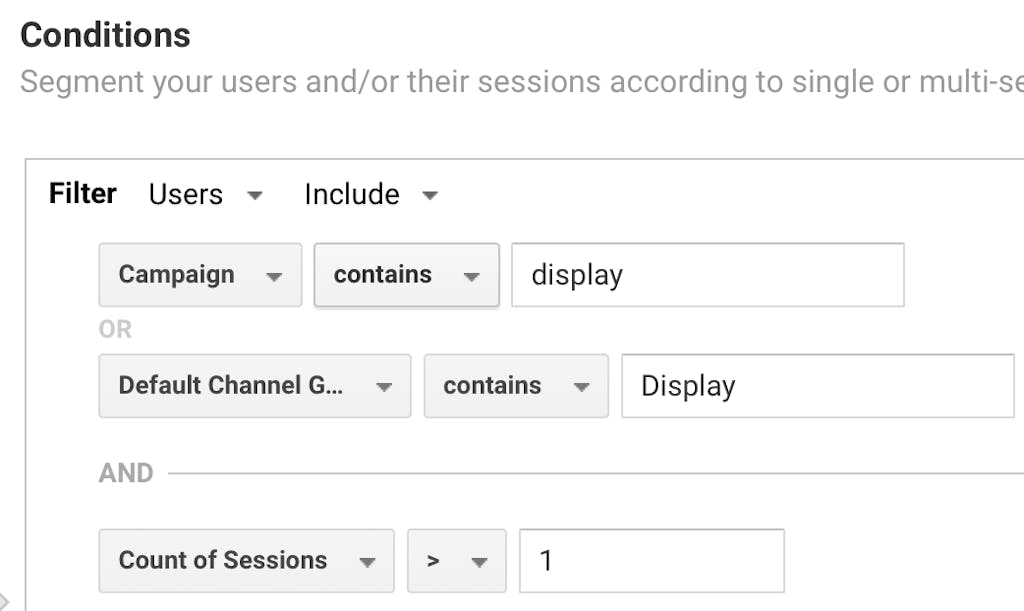
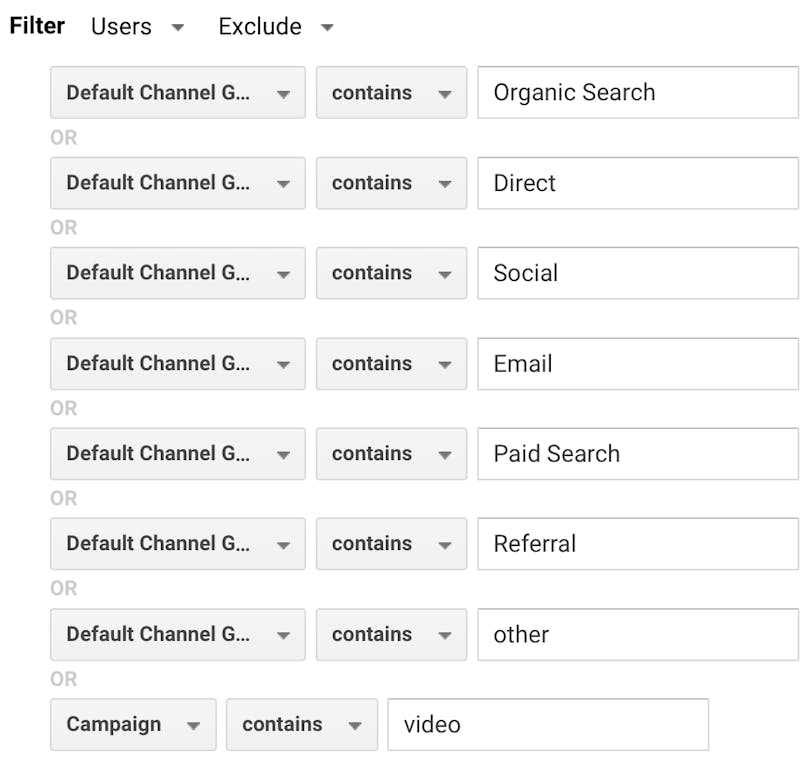
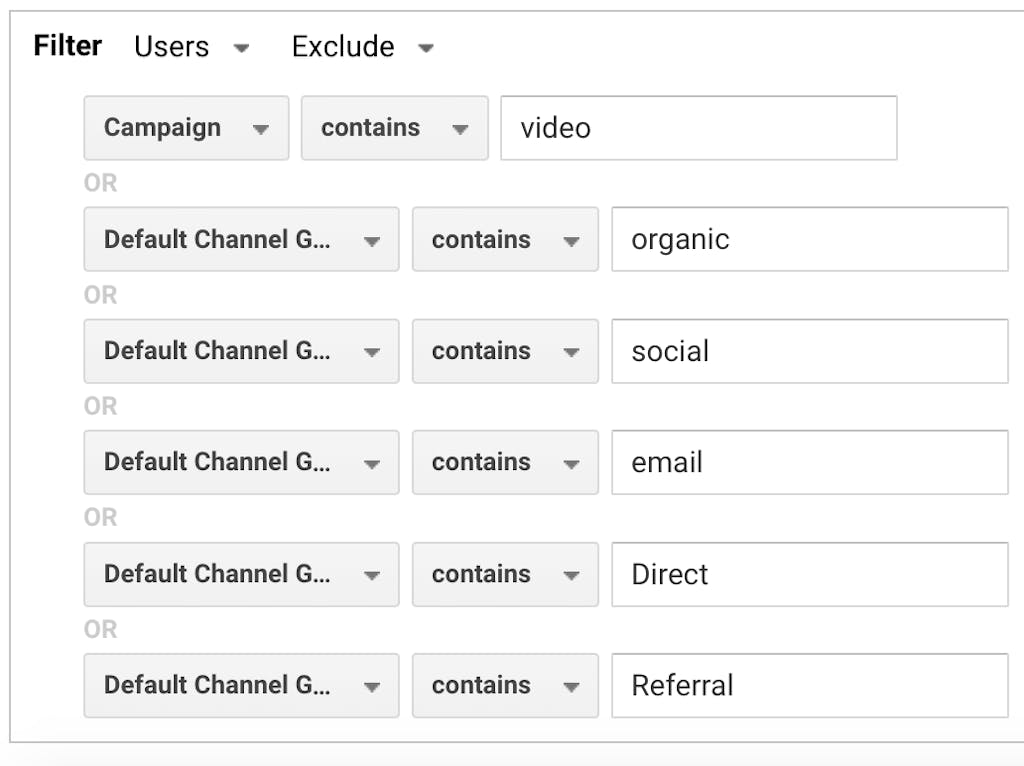
Second Rule: Excludes USERS who have also interacted with other, more common channels. I added campaigns that include the word “Video”, simply because video is often lumped into the Display channel. Change this to reflect your own campaign naming convention if need be:
Third Rule: Includes USERS who were NEW visitors to the website. This just further refines the segment to ensure we are only examining new traffic acquisition from Display, and not any remarketing or pre-existing traffic to the website that may have interacted through Display:

Result: When this segment is run, it shows you the campaigns and placements that consistently generate fake traffic via the same set of users. Pesky fake traffic!!
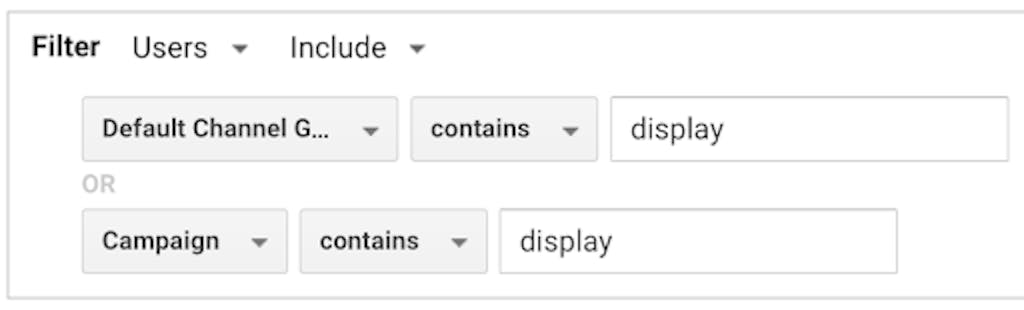
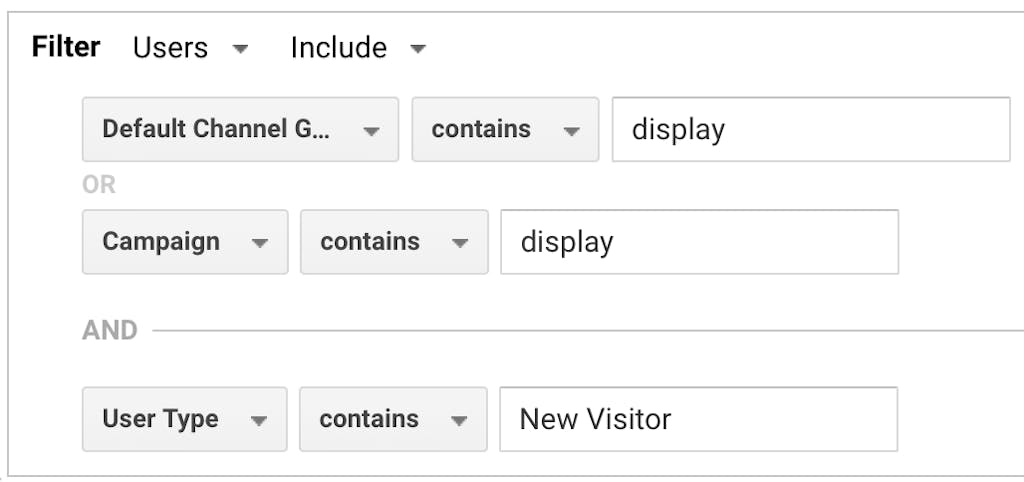
First Rule: Includes USERS who interacted with display:
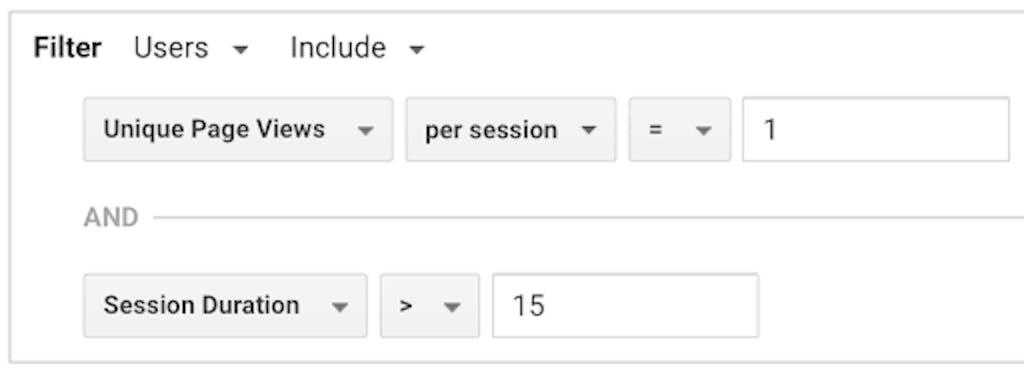
Second Rule: Includes USERS who only visited 1 page during their session, AND who managed to log more than 15 seconds in their session:
Third Rule: Excludes USERS who interacted with other common channels:
Result: when run, shows you the fake traffic that tries to hide behind high-engagement. Can’t fool us!!
First Rule: Includes USERS who interacted with Display AND who were new visitors:
Second Rule: Includes USERS who generated more than 2 goals. Be sure to change the Goal Completion rule to "Per User", rather than "Per Session", as we're interested in return goal completion behaviour here:
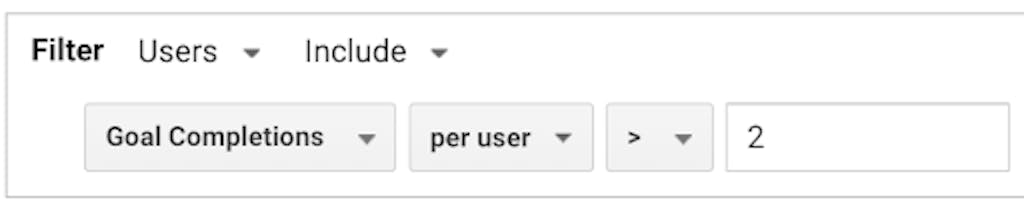
Result: when run, this segment will show Display users who have subsequently gone on to produce multiple goals from Display activity. Depending on what goals you track, this may be genuine, but it helps to have a way of double-checking. An additional red flag for your arsenal!
You may find these segments flag up lots of low-quality traffic through your Display campaigns, or you may find a low instance of fake traffic from your Display campaigns. Every campaign is different!
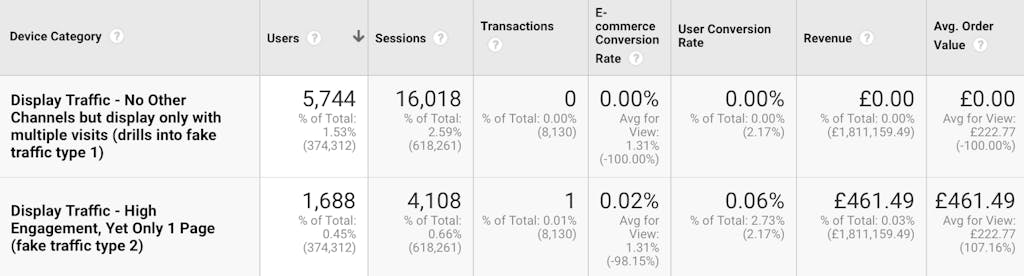
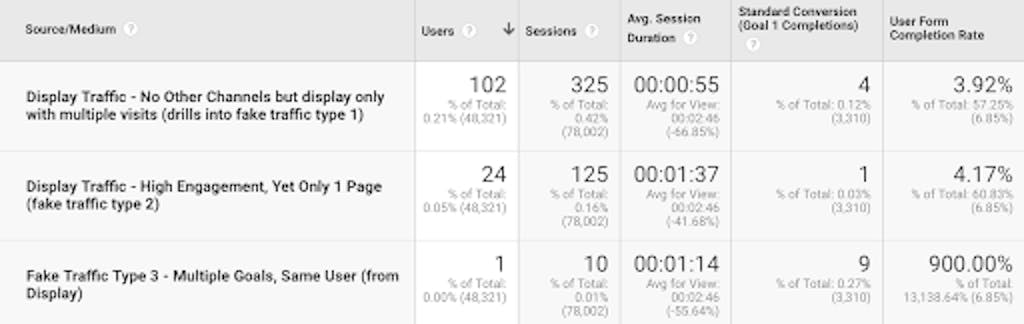
What you may find if you’re an e-commerce website, is that when you run these segments you will still see the odd genuine sale or lead trickling through them. This is to be expected because real-life humans do generate behaviour that is out-of-the-norm, and you will invariably capture a handful that falls into the segment. However, you may also consistently find that the instance of a sale tacking place (the conversion rate) is nearly always far lower than your site average or other segments you tend to run. In short: traffic which falls into the categories into which we are drilling down is nearly always far, far less likely to convert.
An e-commerce website with the segments running - only 1 genuine transaction logged from the fake segments, and take a look at that stinky conversion rate of those fake users!
Below are the results from an old lead-generation campaign which only ran for 24 hours. Notice the 1 user who had generated 9 goals on the lead form. As an aside, I examined every single lead from that Display campaign during this 24-hour period, and each and every one of them was spam - not a single lead generated was genuine. Interestingly this particular example was the result of my first ever trial of Google’s Pay For Conversions model. And yes, those 9 goals generated by the same user had generated 9 times worth of cost on the CPA model. Suffice to say I was straight on to Google after pausing the campaign, asking for a refund!
With these three, powerful segments you can examine in Google Analytics which Display campaigns are generating the highest volume of low-quality clicks that seldom convert.
The segments really come into their own when identifying potential fake leads, when understanding which campaigns require a change in targeting, and to determine if particular placements are consistent offenders that you can subsequently exclude to save you money. Don’t assume that every visitor in those segments is fake, as they will of course also include some genuine traffic mixed in with them, based on odd user behaviour. Do not necessarily rush to pause those campaigns - there may be some decent value mixed in alongside the fake traffic. Also - and sadly - do not make the mistake of thinking that Google owes you a refund for every fake visitor generated to your website from Display activity: remember, Google should be crediting you for most of the fraudulent clicks you receive.
Do note that there will always be a mix of fake traffic and genuine traffic being generated by your campaigns. The question is whether you are happy with the proportion of low-quality traffic you are paying for, versus the final, actual lead or sale output. As with all things, it is very much a case-by-case basis. However, with these new segments, hopefully, you can start questioning the quality of traffic from your display campaigns, to gain some data-led, actionable insights.
I hope that these segments give you a chance to question the true success of your display campaigns, particularly for advertisers who are not using captcha forms and running lead-only campaigns without any offline sales tracking. For those advertisers spending thousands or more per month on display campaigns, consider this: it may be easier to assume that everything is dandy and all those leads are of superb quality, but in my experience true transformation and business growth comes from asking the difficult questions, facing issues head-on, and fixing them. Regardless of whether you are a lead generation or e-commerce website, if you investigate your display traffic and find that you are getting low-quality traffic and/or leads, then you now have some additional tools to hand and a case for taking steps to fix it, whether through introducing captcha forms or a more robust lead-to-sale pipeline tracking system.
At the start of the year, I began working on a tool that would help speed up my fake traffic analysis and help to better understand en-masse where fake traffic was coming from. I’m not all doom-and-gloom though: the point was also to run the reverse, and find out where all the real-life, high-quality traffic was coming from, particularly when running a new Display campaign where there was little historic data to work from.
My tool utilises the three traffic segment types we discussed, as well as some others that are bespoke for various uses, and compares the results with overall display traffic, genuine leads (if it is a lead-generation website), and/or online sales for e-commerce. At the most basic level, it reports to me a breakdown of the top fake offenders, alongside the highest quality placements. It does this using a scoring system which, among other things, factors in:
It took a fair bit of time perfecting the scoring algorithm to come up with a consistently workable method, but I’m very pleased with the end result and it really speeds up my analysis time on Display campaigns and has enabled me to really optimise for higher revenue or lead quality. It has a basic dashboard, plus the ability to deep-dive into the various aspects of the campaign. I will have to omit some data for privacy, such as placement and campaign names, so please bear with me while I show what I can.
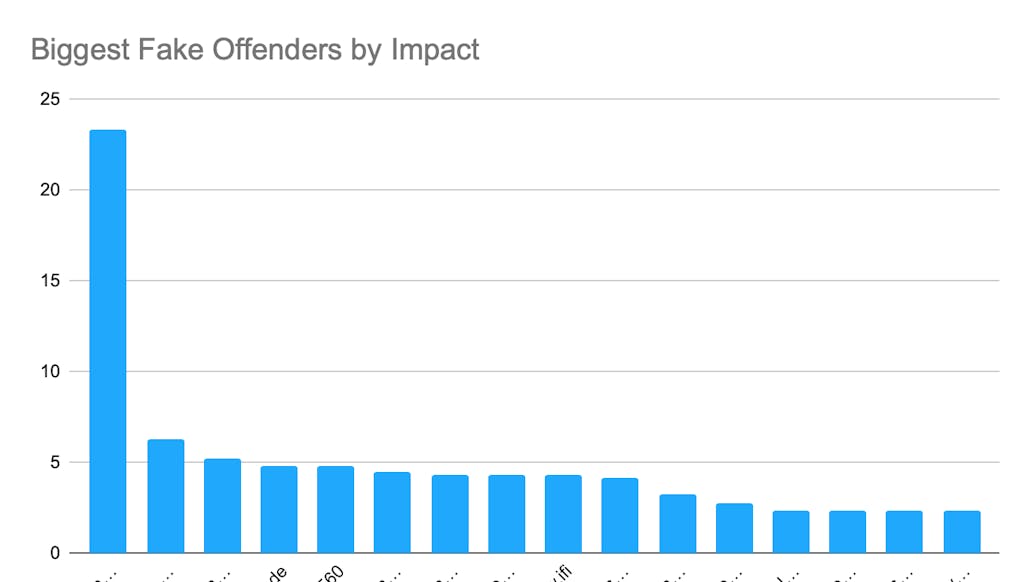
Top placements as a graph (I’ve removed the actual placement names so as to not offend any publishers):
Which type of placement generates the most fake traffic (web placements or mobile apps). Bet you can guess the answer. Below, the image is saying that 99% of fake traffic is generated by mobile apps.
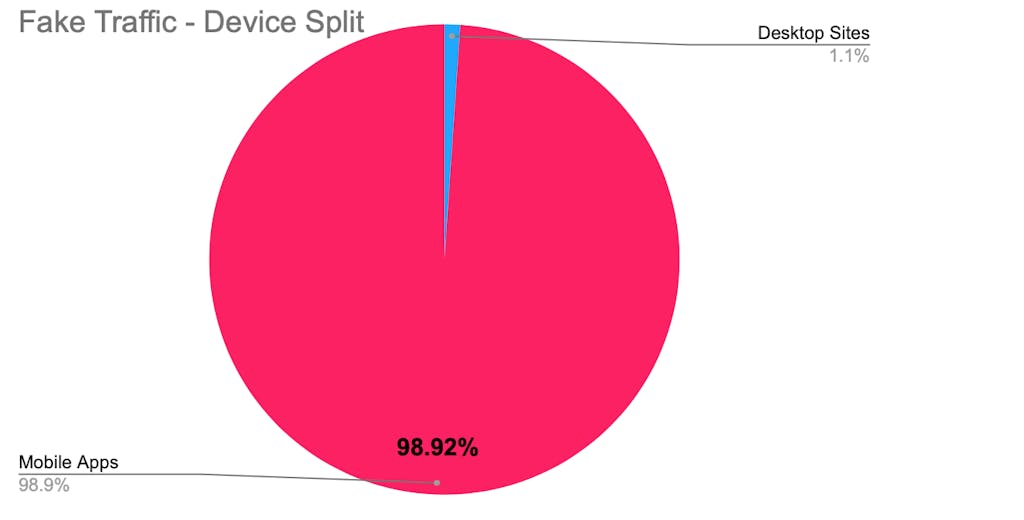
It is nearly always the case that the majority of fake traffic is generated by apps. As such this gives me data-led confidence to exclude apps. Google recently removed the ability to exclude apps, so all of my outreach Display campaigns now comprise my own manual network of thousands of sites that DON’T include apps by standard, based on placement data from the past 5 years which I regularly update. Advertisers should also consider doing this.
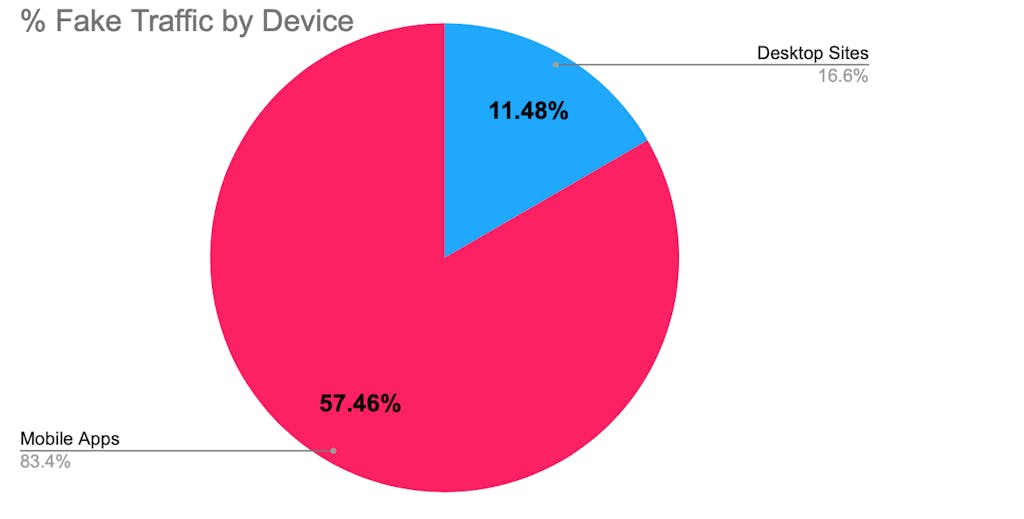
Taking things a step further, the percentage of fake traffic generated for each placement type. Below, we can see that 57% of app traffic is fake, versus only 12% of website placements:
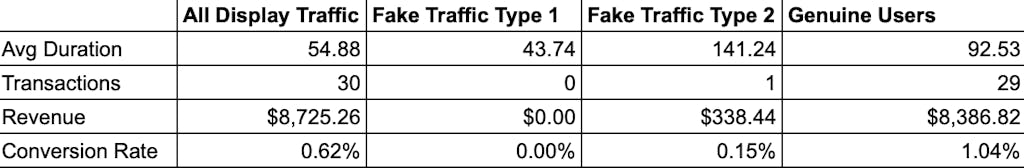
I like to have lots of other stats to hand on the tool too, such as the average duration of fake users, versus genuine users. And alongside this, I like to compare transaction volume and conversion rates generated by the users I have flagged as being most likely “fake”, versus genuine traffic. Below shows a two-week period for a test display campaign. Funnily enough, you will see that fake traffic is often a much higher duration compared to that of real users who successfully purchased! So I always get the real duration figure to hand, and compare it to the inflated average, when factoring this into my quality score:
And of course, also included are fully sortable tables showing:
This is just a brief example of how the tool works and what it can do, but I have plans to further expand it. In the meantime, it works very well for now and is fit for my own purposes of Display optimisation :)
I hope this article has given you food-for-thought about the sheer amount of low-quality traffic on the Google Display Network. As I said before, I love Display advertising, but it can be fraught with many hidden pitfalls that many advertisers - particular lead-generation businesses - can fall victim to. Analyse and optimise!
Google is making changes to how both organic and paid listings look in the...

In this episode, Mark Williams-Cook and Rob Lewis will be covering the Google...